


Trusted by over 15 Million Traders
The Most Awarded Broker
for a Reason
Easy Access to 1,400+ Global Assets
EURUSD
Euro vs U.S. Dollar
US500
S&P 500 (US500)
GOLD
Gold
COFFEE
US Coffee
Apple
Apple (AAPL.OQ)
-

Finance Magnates 颁发
-

Finance Magnates 颁发
-

Capital Finance International Magazine (CFI.co) 2024年颁赠
-

COLWMA 2024年颁赠
-

荣获World Finance Forex Awards 2023最佳外汇客户服务奖
-

荣获World Finance Forex Awards 2023欧洲最佳外汇经纪商奖
-

荣获World Finance Forex Awards 2023澳大拉西亚最佳外汇经纪商奖
-

荣获World Finance Forex Awards 2023拉丁美洲最佳外汇经纪商奖
-

荣获World Finance Forex Awards 2023中东最佳外汇经纪商奖
-

CFI.co于2023年颁赠
-

荣获2023年City of London Wealth Management Awards
-

荣获2022年埃及金融博览会颁赠
-

荣获2022年City of London Wealth Management Awards
-

CFI.co于2022年颁赠
-

荣获Global Forex Awards 2022 — 零售外汇 颁赠
-
2021年迪拜外汇博览会获颁赠
-

Ultimate Fintech 2021年颁赠
-

荣获2021年City of London Wealth Management Awards
-

FX168于2020年12月颁赠
-

荣获Global Business Awards 2020
-

荣获2020年City of London Wealth Management Awards
-

Capital Finance International Magazine (CFI.co)颁赠
-

Capital Finance International Magazine (CFI.co)颁赠
-

荣获2019年City of London Wealth Management Awards
-

Shares Magazine 授予 UK Forex Awards 2018
-

Capital Finance International Magazine (CFI.co)颁赠
-

Capital Finance International Magazine (CFI.co)颁赠
-

2017年伦敦财富管理奖
-

2016最佳本土 客户服务
-

中东和北非地区(MENA)增长最快的经纪商
-
2015年最佳外汇科技提供商
-
2014年最佳外汇科技提供商
-

2014年最佳外汇科技提供商
-

荣获 The Trading Show 2024年非洲 Africa Fintech 峰会颁赠
-

荣获2024年中东地区 Brokersview 颁赠
-
荣获2024年中东地区 Brokersview 颁赠
-

荣获2024年阿曼 Smart Vision 峰会颁赠
-

荣获2024年迪拜外汇博览会颁赠
-

荣获2024年迪拜 Forex Traders Summit 颁赠
-

2024年埃及 Smart Vision 峰会颁赠
-

投查查于2024年颁赠
-

Capital Finance International Magazine (CFI.co) 2024年颁赠
-

CFI.co于2023年颁赠
-

CFI.co于2023年颁赠
-

交易社区平台FOLLOWME于2022年颁赠
-
2022年迪拜Forex Expo获颁赠
-
2022年迪拜Forex Expo获颁赠
-

荣获Global Forex Awards 2022 — 零售外汇 颁赠
-

CFI.co于2022年颁赠
-

CFI.co于2022年颁赠
-

World Finance Forex Awards 2022 颁发
-

World Finance Forex Awards 2022 颁发
-

World Finance Forex Awards 2022 颁发
-

World Finance Forex Awards 2022 颁发
-
交易社区平台FOLLOWME于2021年颁赠
-

2021年埃及Smart Vision Investment Expo博览会获颁赠
-

CFI.co于2021年颁赠
-

CFI.co于2021年颁赠
-

荣获Global Forex Awards 2021 — 零售外汇 颁赠
-

荣获Global Forex Awards 2021 — 零售外汇 颁赠
-

World Finance 2021颁发
-

World Finance 2021颁发
-
FOLLOWME于2021年颁赠
-

Global Forex Awards 2021 — B2B 颁赠
-

Global Forex Awards颁赠
-

Global Forex Awards颁赠
-

CFI.co于2020年颁赠
-

CFI.co于2020年颁赠
-

荣获Global Business Awards 2020
-

World Finance Magazine 颁赠
World Finance Forex Awards 2020 -

World Finance Magazine 颁赠
World Finance Forex Awards 2020 -
FOLLOWME交易社区授予
-

Global Forex Awards颁赠
-

Global Forex Awards颁赠
-

FinTech Age Awards颁发
-

World Finance Magazine 颁赠
World Finance Forex Awards 2019 -

World Finance Magazine 颁赠
World Finance Forex Awards 2019 -

荣获 World Finance Forex Awards 2018 颁赠
-

荣获2018年埃及金融博览会颁赠
-

荣获 Shares Magazine 的 UK Forex Awards 2017 颁赠
-

荣获 World Finance Forex Awards 2017
-

2016年最佳黄金经纪商
-

2016年最佳外汇经纪商
-

2015年最佳本地客户服务
-

Global Brands Magazine 颁赠
-

Online Money Awards 2022 颁发
-

荣获2022年埃及金融博览会颁赠
-

2015最佳外汇交易平台
-

2015最佳金融交易平台
-

2013最佳创新外汇平台奖
-

2020年 Cyprus HR Awards 颁赠
-

金融行业的佼佼者
-

认证最优金牌级别
-

2014年首届亚军
-
Finance Magnates 颁发
-
Finance Magnates 颁发
-
Capital Finance International Magazine (CFI.co) 2024年颁赠
-
COLWMA 2024年颁赠
-
荣获World Finance Forex Awards 2023最佳外汇客户服务奖
-
荣获World Finance Forex Awards 2023欧洲最佳外汇经纪商奖
-
荣获World Finance Forex Awards 2023澳大拉西亚最佳外汇经纪商奖
-
荣获World Finance Forex Awards 2023拉丁美洲最佳外汇经纪商奖
-
荣获World Finance Forex Awards 2023中东最佳外汇经纪商奖
-
CFI.co于2023年颁赠
-
荣获2023年City of London Wealth Management Awards
-
荣获2022年埃及金融博览会颁赠
-
荣获2022年City of London Wealth Management Awards
-
CFI.co于2022年颁赠
-
荣获Global Forex Awards 2022 — 零售外汇 颁赠
-
2021年迪拜外汇博览会获颁赠
-
Ultimate Fintech 2021年颁赠
-
荣获2021年City of London Wealth Management Awards
-
FX168于2020年12月颁赠
-
荣获Global Business Awards 2020
-
荣获2020年City of London Wealth Management Awards
-
Capital Finance International Magazine (CFI.co)颁赠
-
Capital Finance International Magazine (CFI.co)颁赠
-
荣获2019年City of London Wealth Management Awards
-
Shares Magazine 授予 UK Forex Awards 2018
-
Capital Finance International Magazine (CFI.co)颁赠
-
Capital Finance International Magazine (CFI.co)颁赠
-
2017年伦敦财富管理奖
-
2016最佳本土 客户服务
-
中东和北非地区(MENA)增长最快的经纪商
-
2015年最佳外汇科技提供商
-
2014年最佳外汇科技提供商
-
2014年最佳外汇科技提供商
-
荣获 The Trading Show 2024年非洲 Africa Fintech 峰会颁赠
-
荣获2024年中东地区 Brokersview 颁赠
-
荣获2024年中东地区 Brokersview 颁赠
-
荣获2024年阿曼 Smart Vision 峰会颁赠
-
荣获2024年迪拜外汇博览会颁赠
-
荣获2024年迪拜 Forex Traders Summit 颁赠
-
2024年埃及 Smart Vision 峰会颁赠
-
投查查于2024年颁赠
-
Capital Finance International Magazine (CFI.co) 2024年颁赠
-
CFI.co于2023年颁赠
-
CFI.co于2023年颁赠
-
交易社区平台FOLLOWME于2022年颁赠
-
2022年迪拜Forex Expo获颁赠
-
2022年迪拜Forex Expo获颁赠
-
荣获Global Forex Awards 2022 — 零售外汇 颁赠
-
CFI.co于2022年颁赠
-
CFI.co于2022年颁赠
-
World Finance Forex Awards 2022 颁发
-
World Finance Forex Awards 2022 颁发
-
World Finance Forex Awards 2022 颁发
-
World Finance Forex Awards 2022 颁发
-
交易社区平台FOLLOWME于2021年颁赠
-
2021年埃及Smart Vision Investment Expo博览会获颁赠
-
CFI.co于2021年颁赠
-
CFI.co于2021年颁赠
-
荣获Global Forex Awards 2021 — 零售外汇 颁赠
-
荣获Global Forex Awards 2021 — 零售外汇 颁赠
-
World Finance 2021颁发
-
World Finance 2021颁发
-
FOLLOWME于2021年颁赠
-
Global Forex Awards 2021 — B2B 颁赠
-
Global Forex Awards颁赠
-
Global Forex Awards颁赠
-
CFI.co于2020年颁赠
-
CFI.co于2020年颁赠
-
荣获Global Business Awards 2020
-
World Finance Magazine 颁赠
World Finance Forex Awards 2020 -
World Finance Magazine 颁赠
World Finance Forex Awards 2020 -
FOLLOWME交易社区授予
-
Global Forex Awards颁赠
-
Global Forex Awards颁赠
-
FinTech Age Awards颁发
-
World Finance Magazine 颁赠
World Finance Forex Awards 2019 -
World Finance Magazine 颁赠
World Finance Forex Awards 2019 -
荣获 World Finance Forex Awards 2018 颁赠
-
荣获2018年埃及金融博览会颁赠
-
荣获 Shares Magazine 的 UK Forex Awards 2017 颁赠
-
荣获 World Finance Forex Awards 2017
-
2016年最佳黄金经纪商
-
2016年最佳外汇经纪商
-
2015年最佳本地客户服务
-
Global Brands Magazine 颁赠
-
Online Money Awards 2022 颁发
-
荣获2022年埃及金融博览会颁赠
-
2015最佳外汇交易平台
-
2015最佳金融交易平台
-
2013最佳创新外汇平台奖
-
2020年 Cyprus HR Awards 颁赠
-
金融行业的佼佼者
-
认证最优金牌级别
-
2014年首届亚军

Awarded BestBrokerYear After Year
CATEGORIES
News
- The long and short factors enter a new round of game, and the direction of palm
- Gold sticks to the lower track support of the daily small convergence triangle a
- Li Auto "stalled" from profit to loss, delivering its worst financial report in
- Fed meeting minutes reveal serious differences, non-farm payrolls are coming ton
- Global market outlook under the intersection of PMI, small non-agriculture and c
market analysis
The weekly sun has reached the top again, gold and silver are waiting for new highs
Wonderful introduction:
Only by setting off, can you reach your ideals and destinations, only by hard work can you achieve brilliant success, and only by sowing can you reap the rewards. Only by pursuing can you taste upright people.
Hello everyone, today XM Forex will bring you "[XM Foreign Exchange Decision Analysis]: The weekly sun has reached the top again, and gold and silver are waiting for new highs." Hope this helps you! The original content is as follows:
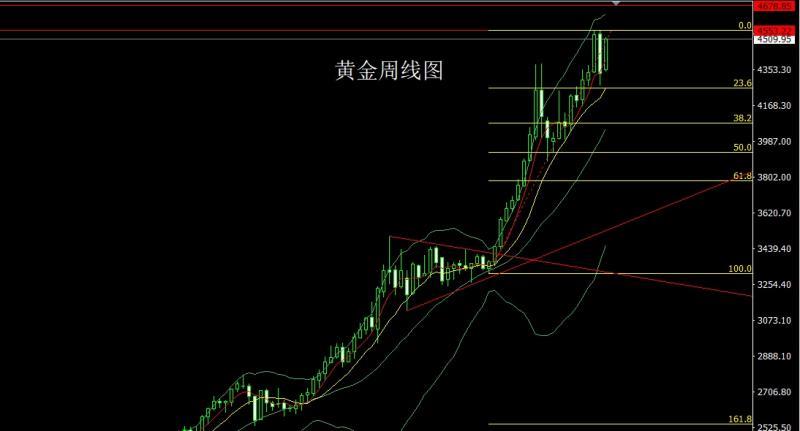
Last week, the gold market opened higher at 4350.5 due to risk aversion sentiment at the beginning of next week. After that, the market retreated slightly to reach the position of 4345. After that, the market fluctuated strongly and rose. By Friday, the weekly high after non-farm payrolls hit the position of 4517.6. After finishing, after the weekly line finally closed at 4509.95, the weekly line closed with a saturated positive line with a slight upper and lower shadow line. After such a form ended, the market continued to be bullish this week. In terms of points, the bullish line below was 3325 and 3322 and 3368- The long of 3370 and the long of 3377 and 3385 and the long of 3563 were followed up with stop loss at 4000 after reducing the position. The previous week's long of 4176 and 4174 and the long of 4187 and 4184 and the long of 4208 and 4205 were followed up with stop loss at 42 10 holds. After last Friday's long reduction of 4455, the stop loss follow-up is held at 4460. Today, the stop loss is 4474 when the long position is 4480. The target is 4500 and 4517. If the position is broken, the historical pressure of 4524 and 4532 and 4543 and 4552 will xmmarkets.cnpete.
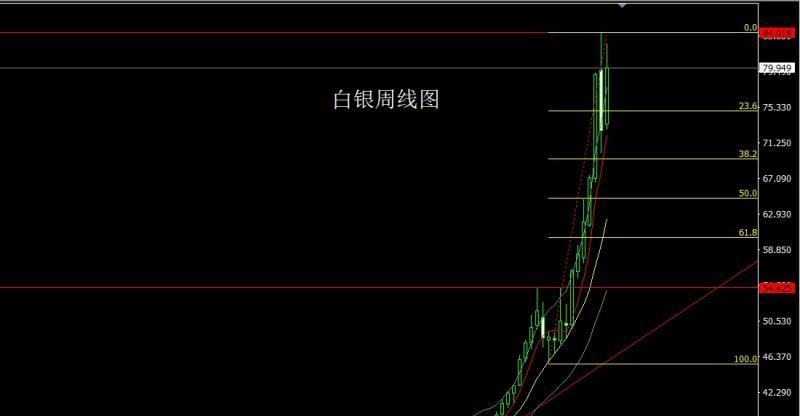
The silver market opened slightly higher last week at 73.403, then the market fell first. The weekly low reached 72.837, and then the market rose strongly. The weekly high will reach 82.7 It fell back quickly after reaching the position of 66, and then rose in late trading after reaching the position of 73.807. After the weekly line finally closed at the position of 79.949, the weekly line closed with a big positive line with a long upper shadow line, and this form closedAfter the end, the market continued to be long this week. In terms of points, the longs at 37.8 below, the longs at 38.8, the longs at 50.75, and the longs at 52.7 were followed up with stop losses at 68. Today, the stop loss is at 77.6, which is more than 78. The target is 79, 80, and 81-82.
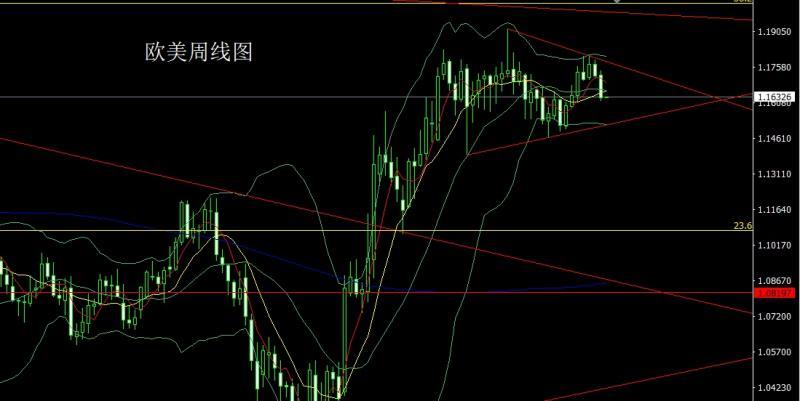
European and American markets fell sharply after opening at 1.17238 last week. After reaching 1.16576, the market rose strongly. The weekly high finally touched the 1.17428 position and then fell back. The weekly low reached the 1.16165 position and then consolidated. The weekly line finally closed at 1.16295. After the position, the weekly line closes with a big negative line with the upper shadow line slightly longer than the lower shadow line. After the end of this form, there is downward pressure this week. At the point, 1.16500 is short today, stop loss is 1.16650, and the target is 1.16200, 1.16000 and 1.15800-1.15600.

The U.S. crude oil market opened at 57.01 last week and then the market first rose to a position of 58.88 and then quickly fell back. The weekly low reached a position of 55.76 and then rose strongly in late trading. The weekly high hit a position of 59.8 the following week. After the line finally closed at 58.76, the weekly line closed with a Zhongyang line with a lower shadow line slightly longer than the upper shadow line. After this form ended, the stop loss was 57.55 for more than 58 today, and the target cards were 59, 59.9 and 60.5-61.

The Nasdaq opened at 25246.75 last week, then stepped back to 25251.52 and then rose strongly. The highest weekly line touched 25817.77 and then consolidated. After the weekly line finally closed at 25758.38, the weekly line closed with a big positive line with a slightly longer upper shadow line. After such a form ended, there was bullish demand this week. Points At the position, today’s 25600 is more than 25530, and the target is 25750 and 25850, 25950 and 26000.
Fundamentals, last week’s fundamentals: The United States attacked Venezuela the previous weekend and captured President Maduro after returning to the country, which caused strong condemnation from the international xmmarkets.cnmunity. Maduro also refused to plead guilty in court. In this context, the President of the United States threatened many countries! Greenland has become the next focus. World rules and regulations are being trampled by the United States. Non-farm payroll data on Friday showed that non-farm employment increased by 50,000 in December after seasonally adjustment, which was lower than the expected 60,000. The unemployment rate was recorded at 4.4%, lower than the expected 4.5%. The previous value was revised from 4.6% to 4.5%. In addition, the monthly average hourly wage rate in December recordedIt was 0.3%, which was the same as expected. The previous value was revised from 0.10% to 0.2%. Judging from annual data, non-agricultural employment will increase by 584,000 people in 2025, with an average monthly increase of 49,000 people, which is lower than the increase of 2 million people in 2024 (an average monthly increase of 168,000 people). This is the weakest annual growth since 2020 (affected by the epidemic). If the epidemic years are excluded, it is also the weakest annual performance since the economic expansion period from 2010 to 2019. The market generally believes that the decline in unemployment rate actually "closes the door for the Federal Reserve to cut interest rates in January." Data from the interest rate swap market shows that traders now believe that the possibility of a rate cut in January has dropped to zero, with the market pricing in favor of a slower pace of interest rate cuts by the Federal Reserve. This week's fundamentals focus on the Eurozone's January Sentix Investor Confidence Index at 17:30 on Monday. In addition, today we also need to pay attention to China's December M2 money supply annual rate. On Tuesday, focus on the U.S. non-seasonally adjusted annual CPI rate in December at 21:30. This round is expected to be 2.7%, xmmarkets.cnpared with the previous value of 2.7%. Then look at the annualized total number of new home sales in the United States in October at 23:00. On Wednesday, focus on the U.S. November retail sales monthly rate and the U.S. November PPI annual rate at 21:30. Later, we will look at the U.S. October xmmarkets.cnmercial inventory monthly rate and the U.S. existing home sales total annualized in December at 23:00. Later, we will look at the U.S. EIA crude oil inventory for the week to January 9, the U.S. EIA Oklahoma Cushing crude oil inventory for the week to January 9, and the U.S. EIA strategic petroleum reserve inventory for the week until January 9. Watch for the Federal Reserve's Beige Book of Economic Conditions to be released at 3:00 a.m. on Thursday. In the evening, look at the number of initial jobless claims in the United States at 21:30 for the week to January 10, the New York Fed manufacturing index in January, the Philadelphia Fed manufacturing index in January, and the monthly rate of the US import price index in November. On Friday, focus on the U.S. December industrial output monthly rate at 22:15 and the U.S. January NAHB housing market index at 23:00.
In terms of operation, gold: 3325 and 3322 are long, 3368-3370 is long, 3377 and 3385 are long, and 3563 is long. After reducing the position, the stop loss is followed up and held at 4000. In the previous week, 4176 and 4174 were long, 4187 and 4184 were long, and 4 The long stop loss of 208 and 4205 is held at 4210. The stop loss follow-up is held at 4460 after the long reduction of 4455 last Friday. Today, the stop loss of more than 4480 is 4474. The target is 4500 and 4517. If the position is broken, the historical pressure of 4524 and 4532 and 4543 and 4552 is xmmarkets.cnpeting.
Silver: The bottom is 37.8 long and 38.8 is long, 50.75 is long and 52.7 is long. After reducing the position, the stop loss is followed at 68. Today, the 78 long stop loss is 77.6. The target is 79, 80 and 81-82. .
Europe and the United States: Short at 1.16500 today, stop loss at 1.16650, target 1.16200, 1.16000 and 1.15800-1.15600.
US originalOil: Stop loss is 57.55 for more than 58 today, target card is 59 and 59.9 and 60.5-61.
Nasdaq: Stop loss is 25530 for more than 25600 today, target is 25750 and 25850 and 25950 and 2 6000.
The above content is all about "[XM Foreign Exchange Decision Analysis]: The weekly sun reaches the top again, and gold and silver are extended to wait for new highs". It is carefully xmmarkets.cnpiled and edited by the editor of XM Foreign Exchange. I hope it will be helpful to your trading! Thanks for the support!
Only the strong know how to fight; the weak are not even qualified to fail, but are born to be conquered. Hurry up and study the next content!
Disclaimers: XM Group only provides execution services and access permissions for online trading platforms, and allows individuals to view and/or use the website or the content provided on the website, but has no intention of making any changes or extensions, nor will it change or extend its services and access permissions. All access and usage permissions will be subject to the following terms and conditions: (i) Terms and conditions; (ii) Risk warning; And (iii) a complete disclaimer. Please note that all information provided on the website is for general informational purposes only. In addition, the content of all XM online trading platforms does not constitute, and cannot be used for any unauthorized financial market trading invitations and/or invitations. Financial market transactions pose significant risks to your investment capital.
All materials published on online trading platforms are only intended for educational/informational purposes and do not include or should be considered for financial, investment tax, or trading related consulting and advice, or transaction price records, or any financial product or non invitation related trading offers or invitations.
All content provided by XM and third-party suppliers on this website, including opinions, news, research, analysis, prices, other information, and third-party website links, remains unchanged and is provided as general market commentary rather than investment advice. All materials published on online trading platforms are only for educational/informational purposes and do not include or should be considered as applicable to financial, investment tax, or trading related advice and recommendations, or transaction price records, or any financial product or non invitation related financial offers or invitations. Please ensure that you have read and fully understood the information on XM's non independent investment research tips and risk warnings. For more details, please click here