


Trusted by over 15 Million Traders
The Most Awarded Broker
for a Reason
Easy Access to 1,400+ Global Assets
EURUSD
Euro vs U.S. Dollar
US500
S&P 500 (US500)
GOLD
Gold
COFFEE
US Coffee
Apple
Apple (AAPL.OQ)
-

Finance Magnates 颁发
-

Finance Magnates 颁发
-

Capital Finance International Magazine (CFI.co) 2024年颁赠
-

COLWMA 2024年颁赠
-

荣获World Finance Forex Awards 2023最佳外汇客户服务奖
-

荣获World Finance Forex Awards 2023欧洲最佳外汇经纪商奖
-

荣获World Finance Forex Awards 2023澳大拉西亚最佳外汇经纪商奖
-

荣获World Finance Forex Awards 2023拉丁美洲最佳外汇经纪商奖
-

荣获World Finance Forex Awards 2023中东最佳外汇经纪商奖
-

CFI.co于2023年颁赠
-

荣获2023年City of London Wealth Management Awards
-

荣获2022年埃及金融博览会颁赠
-

荣获2022年City of London Wealth Management Awards
-

CFI.co于2022年颁赠
-

荣获Global Forex Awards 2022 — 零售外汇 颁赠
-
2021年迪拜外汇博览会获颁赠
-

Ultimate Fintech 2021年颁赠
-

荣获2021年City of London Wealth Management Awards
-

FX168于2020年12月颁赠
-

荣获Global Business Awards 2020
-

荣获2020年City of London Wealth Management Awards
-

Capital Finance International Magazine (CFI.co)颁赠
-

Capital Finance International Magazine (CFI.co)颁赠
-

荣获2019年City of London Wealth Management Awards
-

Shares Magazine 授予 UK Forex Awards 2018
-

Capital Finance International Magazine (CFI.co)颁赠
-

Capital Finance International Magazine (CFI.co)颁赠
-

2017年伦敦财富管理奖
-

2016最佳本土 客户服务
-

中东和北非地区(MENA)增长最快的经纪商
-
2015年最佳外汇科技提供商
-
2014年最佳外汇科技提供商
-

2014年最佳外汇科技提供商
-

荣获 The Trading Show 2024年非洲 Africa Fintech 峰会颁赠
-

荣获2024年中东地区 Brokersview 颁赠
-
荣获2024年中东地区 Brokersview 颁赠
-

荣获2024年阿曼 Smart Vision 峰会颁赠
-

荣获2024年迪拜外汇博览会颁赠
-

荣获2024年迪拜 Forex Traders Summit 颁赠
-

2024年埃及 Smart Vision 峰会颁赠
-

投查查于2024年颁赠
-

Capital Finance International Magazine (CFI.co) 2024年颁赠
-

CFI.co于2023年颁赠
-

CFI.co于2023年颁赠
-

交易社区平台FOLLOWME于2022年颁赠
-
2022年迪拜Forex Expo获颁赠
-
2022年迪拜Forex Expo获颁赠
-

荣获Global Forex Awards 2022 — 零售外汇 颁赠
-

CFI.co于2022年颁赠
-

CFI.co于2022年颁赠
-

World Finance Forex Awards 2022 颁发
-

World Finance Forex Awards 2022 颁发
-

World Finance Forex Awards 2022 颁发
-

World Finance Forex Awards 2022 颁发
-
交易社区平台FOLLOWME于2021年颁赠
-

2021年埃及Smart Vision Investment Expo博览会获颁赠
-

CFI.co于2021年颁赠
-

CFI.co于2021年颁赠
-

荣获Global Forex Awards 2021 — 零售外汇 颁赠
-

荣获Global Forex Awards 2021 — 零售外汇 颁赠
-

World Finance 2021颁发
-

World Finance 2021颁发
-
FOLLOWME于2021年颁赠
-

Global Forex Awards 2021 — B2B 颁赠
-

Global Forex Awards颁赠
-

Global Forex Awards颁赠
-

CFI.co于2020年颁赠
-

CFI.co于2020年颁赠
-

荣获Global Business Awards 2020
-

World Finance Magazine 颁赠
World Finance Forex Awards 2020 -

World Finance Magazine 颁赠
World Finance Forex Awards 2020 -
FOLLOWME交易社区授予
-

Global Forex Awards颁赠
-

Global Forex Awards颁赠
-

FinTech Age Awards颁发
-

World Finance Magazine 颁赠
World Finance Forex Awards 2019 -

World Finance Magazine 颁赠
World Finance Forex Awards 2019 -

荣获 World Finance Forex Awards 2018 颁赠
-

荣获2018年埃及金融博览会颁赠
-

荣获 Shares Magazine 的 UK Forex Awards 2017 颁赠
-

荣获 World Finance Forex Awards 2017
-

2016年最佳黄金经纪商
-

2016年最佳外汇经纪商
-

2015年最佳本地客户服务
-

Global Brands Magazine 颁赠
-

Online Money Awards 2022 颁发
-

荣获2022年埃及金融博览会颁赠
-

2015最佳外汇交易平台
-

2015最佳金融交易平台
-

2013最佳创新外汇平台奖
-

2020年 Cyprus HR Awards 颁赠
-

金融行业的佼佼者
-

认证最优金牌级别
-

2014年首届亚军
-
Finance Magnates 颁发
-
Finance Magnates 颁发
-
Capital Finance International Magazine (CFI.co) 2024年颁赠
-
COLWMA 2024年颁赠
-
荣获World Finance Forex Awards 2023最佳外汇客户服务奖
-
荣获World Finance Forex Awards 2023欧洲最佳外汇经纪商奖
-
荣获World Finance Forex Awards 2023澳大拉西亚最佳外汇经纪商奖
-
荣获World Finance Forex Awards 2023拉丁美洲最佳外汇经纪商奖
-
荣获World Finance Forex Awards 2023中东最佳外汇经纪商奖
-
CFI.co于2023年颁赠
-
荣获2023年City of London Wealth Management Awards
-
荣获2022年埃及金融博览会颁赠
-
荣获2022年City of London Wealth Management Awards
-
CFI.co于2022年颁赠
-
荣获Global Forex Awards 2022 — 零售外汇 颁赠
-
2021年迪拜外汇博览会获颁赠
-
Ultimate Fintech 2021年颁赠
-
荣获2021年City of London Wealth Management Awards
-
FX168于2020年12月颁赠
-
荣获Global Business Awards 2020
-
荣获2020年City of London Wealth Management Awards
-
Capital Finance International Magazine (CFI.co)颁赠
-
Capital Finance International Magazine (CFI.co)颁赠
-
荣获2019年City of London Wealth Management Awards
-
Shares Magazine 授予 UK Forex Awards 2018
-
Capital Finance International Magazine (CFI.co)颁赠
-
Capital Finance International Magazine (CFI.co)颁赠
-
2017年伦敦财富管理奖
-
2016最佳本土 客户服务
-
中东和北非地区(MENA)增长最快的经纪商
-
2015年最佳外汇科技提供商
-
2014年最佳外汇科技提供商
-
2014年最佳外汇科技提供商
-
荣获 The Trading Show 2024年非洲 Africa Fintech 峰会颁赠
-
荣获2024年中东地区 Brokersview 颁赠
-
荣获2024年中东地区 Brokersview 颁赠
-
荣获2024年阿曼 Smart Vision 峰会颁赠
-
荣获2024年迪拜外汇博览会颁赠
-
荣获2024年迪拜 Forex Traders Summit 颁赠
-
2024年埃及 Smart Vision 峰会颁赠
-
投查查于2024年颁赠
-
Capital Finance International Magazine (CFI.co) 2024年颁赠
-
CFI.co于2023年颁赠
-
CFI.co于2023年颁赠
-
交易社区平台FOLLOWME于2022年颁赠
-
2022年迪拜Forex Expo获颁赠
-
2022年迪拜Forex Expo获颁赠
-
荣获Global Forex Awards 2022 — 零售外汇 颁赠
-
CFI.co于2022年颁赠
-
CFI.co于2022年颁赠
-
World Finance Forex Awards 2022 颁发
-
World Finance Forex Awards 2022 颁发
-
World Finance Forex Awards 2022 颁发
-
World Finance Forex Awards 2022 颁发
-
交易社区平台FOLLOWME于2021年颁赠
-
2021年埃及Smart Vision Investment Expo博览会获颁赠
-
CFI.co于2021年颁赠
-
CFI.co于2021年颁赠
-
荣获Global Forex Awards 2021 — 零售外汇 颁赠
-
荣获Global Forex Awards 2021 — 零售外汇 颁赠
-
World Finance 2021颁发
-
World Finance 2021颁发
-
FOLLOWME于2021年颁赠
-
Global Forex Awards 2021 — B2B 颁赠
-
Global Forex Awards颁赠
-
Global Forex Awards颁赠
-
CFI.co于2020年颁赠
-
CFI.co于2020年颁赠
-
荣获Global Business Awards 2020
-
World Finance Magazine 颁赠
World Finance Forex Awards 2020 -
World Finance Magazine 颁赠
World Finance Forex Awards 2020 -
FOLLOWME交易社区授予
-
Global Forex Awards颁赠
-
Global Forex Awards颁赠
-
FinTech Age Awards颁发
-
World Finance Magazine 颁赠
World Finance Forex Awards 2019 -
World Finance Magazine 颁赠
World Finance Forex Awards 2019 -
荣获 World Finance Forex Awards 2018 颁赠
-
荣获2018年埃及金融博览会颁赠
-
荣获 Shares Magazine 的 UK Forex Awards 2017 颁赠
-
荣获 World Finance Forex Awards 2017
-
2016年最佳黄金经纪商
-
2016年最佳外汇经纪商
-
2015年最佳本地客户服务
-
Global Brands Magazine 颁赠
-
Online Money Awards 2022 颁发
-
荣获2022年埃及金融博览会颁赠
-
2015最佳外汇交易平台
-
2015最佳金融交易平台
-
2013最佳创新外汇平台奖
-
2020年 Cyprus HR Awards 颁赠
-
金融行业的佼佼者
-
认证最优金牌级别
-
2014年首届亚军

Awarded BestBrokerYear After Year
CATEGORIES
News
- 【XM Market Analysis】--CAD/JPY Forecast: Likely to Breakout
- 【XM Market Analysis】--GBP/USD Analysis: Increasing Pressure Factors
- 【XM Decision Analysis】--USD/PHP Forex Signal: Faces Resistance at 59 PHP
- 【XM Market Analysis】--Nasdaq Forecast: Awaits CPI Numbers
- 【XM Decision Analysis】--USD/SGD Analysis: Selloff and Price Velocity Bring Suppo
market analysis
The Israeli-Iran ceased, and gold prices fell sharply, "not to break, no establishment, and then to break."
Wonderful introduction:
Walk out of the thorns, there is a bright road covered with flowers; when you reach the top of the mountain, you will see the cloudy mountain scenery like green clouds. In this world, a star falls and cannot dim the starry sky, a flower withers and cannot desolate the whole spring.
Hello everyone, today XM Foreign Exchange will bring you "[XM Foreign Exchange Platform]: The Israeli-Iran ceased sharply, "Not broken, no establishment, break before establishment"". Hope it will be helpful to you! The original content is as follows:
Zheng's silver point: In Iraq, the gold price fell sharply, "not breaking, not standing, breaking, and then standing"
Review yesterday's market trend and technical points:
First, gold: Yesterday's morning jumped high, and fell back to the 618 segment position 3364 to try to stabilize and bullish, but did not support it effectively, so I directly washed the market back; in the afternoon, there was a long hour line below the K stabilized shape Then 3352 tried to be bullish, and the European session rose to 3280. If the strength was too strong, it was believed that the US session would continue, and the target 3358 continued to be bullish. The target 3390 test was in place. After reducing holdings at highs, it was believed that gold risk aversion had returned and was relatively strong, so it left a bottom position to try to get the band. As a result, the news surface in the second half of the night came a 180-degree reversal. The direct ceasefire of Iraq and the rise and fall was also used to protect the capital;
Second , silver: At that time, gold opened high and then fell all the way. I was worried that silver would follow, and the 36 line prompted the capital to adjust its position. As a result, the US market still fluctuated and rose to close to 36.35-36.4;
Third, crude oil: yesterday's layout failed twice, each time the profit was only 70 points, and it did not reach the first target of 100 points to reduce holdings; from the daily line pattern, it refers to the previous week's move, every day it is The 5 moving average fluctuated and rose all the way. On Monday, they jumped high and closed with a big negative. They thought that as long as the closing stabilized the 5 moving average, there would be a probability of closing positive on Tuesday. But all this requires the support of the news. When the ceasefire in the second half of the night and the old man kept shouting to suppress oil prices, they could not technically bear the news. If they could not hold on to the 5 moving average, they would directly fall. At that time, the stop loss would play a key role;
Interpretation of today's market analysis:
Interpretation of today's market analysis:
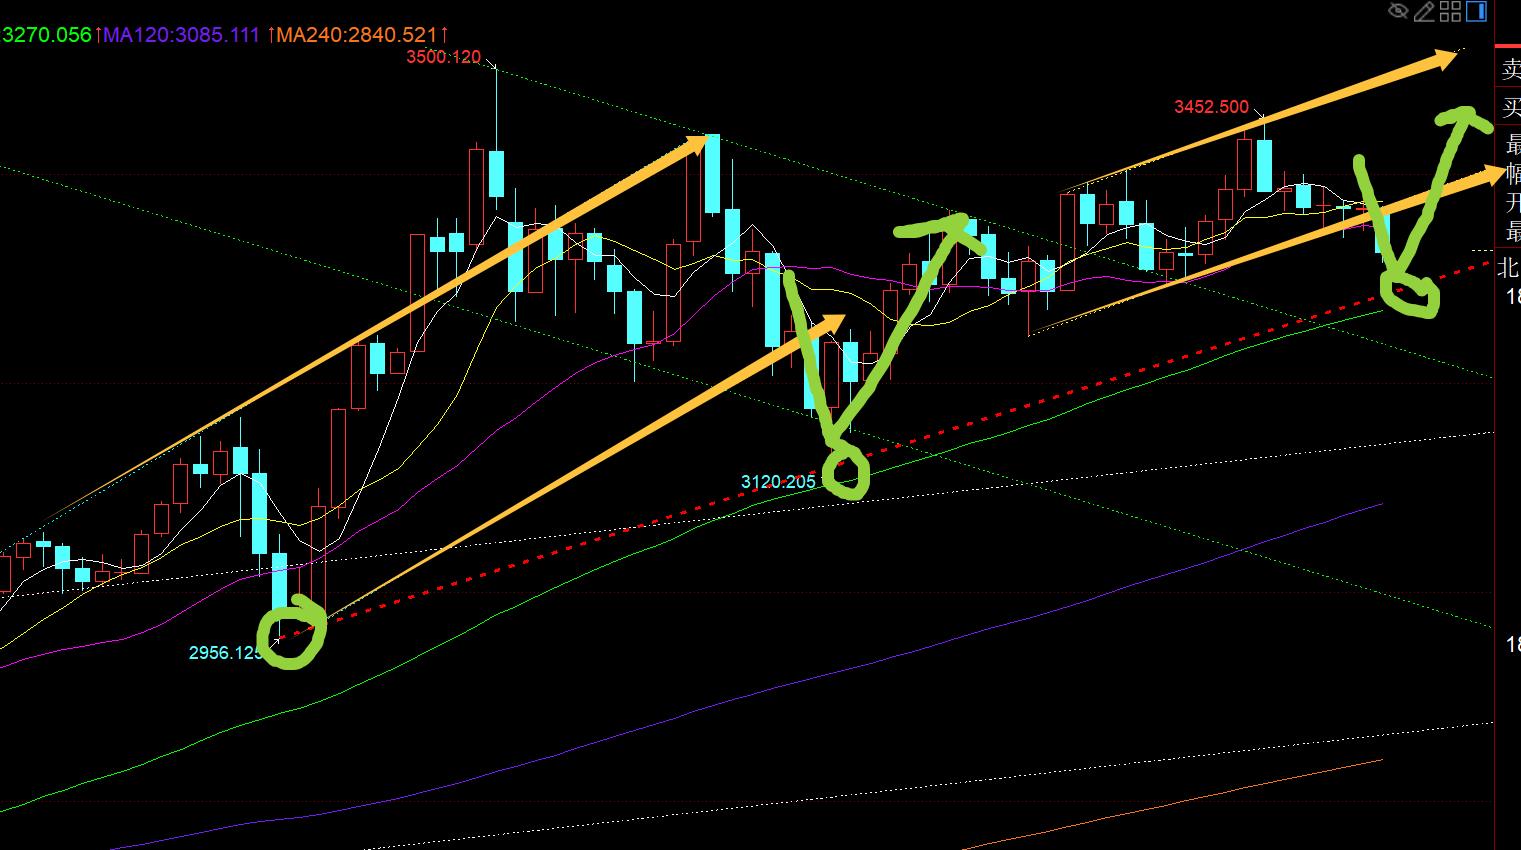
First, gold daily line level: From the above chart, the previous three consecutive days closed at cross K, and the closing price stabilized the lower track of the channel in the past few weeks, but today it continued to fall sharply during the day. At this time, the low level of the negative line is somewhat far from the lower track, and there is a probability of effectively breaking the channel; but this does not mean that it will continue much space, because the support of a red trend line below is not far. It is connected by the low point of the trend rise in the past few months, and its support will be strong; xmmarkets.cnbined with the previous wave of stabilization of 3120, it is also possible to continue to move. A trend of "not breaking the disadvantage, breaking and then standing", that is, only by breaking the lower track of the channel first, can we break the force in a few days later and then make a very favorable breakthrough; then the middle retention area between the red trend line and the yellow trend line is the key support area within the next few days. It will probably fluctuate for a few days if the lock is about 3350-3300. If you accurately test the support point of the red trend line, it is around 3290, which happens to be the starting point on June 9. Therefore, when it is close to 3290-3300, it should be a good position for scouting guys. First, you should try it lightly. Yes; the short-term strong pressure is 3390-3400. If you can't test it many times, you can strengthen and impact 3500-3550 after breaking through the market, and then you can't stand up in the future to strengthen and impact 3500-3550; then before 3400 breaks through the market, you can temporarily continue to oscillate and correct the situation. It is best to trade sideways again in the range, digest the bear momentum indicator through time, and then the bull momentum indicator in the future, which can better exert force;
Second, the golden hourly line level: continue to plunge overnight, and the opening of today will directly fall sharply. After the lower track of the 3350 channel is effectively lost, a new shock will be launched downward. Swing range; the Asian session is currently down, the European session is unable to rebound, and the US session has a probability of a second decline. If you rebound first, it is easy to lure long. You can choose the opportunity to issue a pressure signal and then fall in the short term. Refer to the resistance level 618 3341 line first xmmarkets.cne first to look down; if you do not rebound and continue to fall directly, then support will move down and pay attention to the 3312-11 line, touch the stabilization and try to see the bottom divergence and the oversold rebound. The more you fall, the more you dare to try to see the rebound. The market trends in the past few days, I believe everyone knows that breaking the previous low point will always be prone to a sharp pull of 20 to 30 meters;
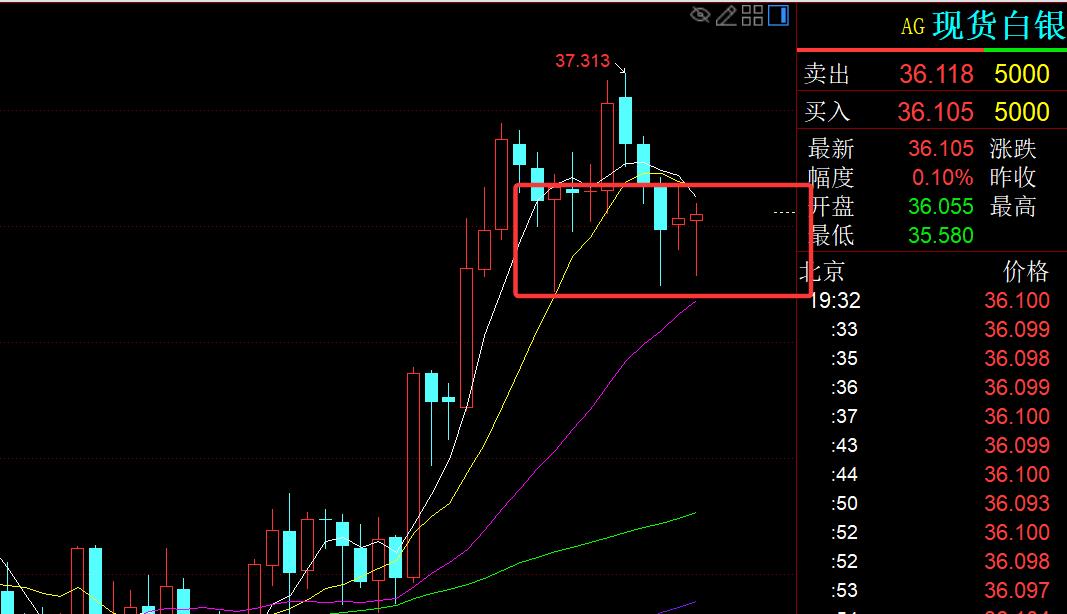
In terms of silver: It has not had much turbulence, the resistance is still 36.4, and the support is still 35.3. Continue to sort out in the range, exchange time for space, and wait for the future market to stabilize and rise;
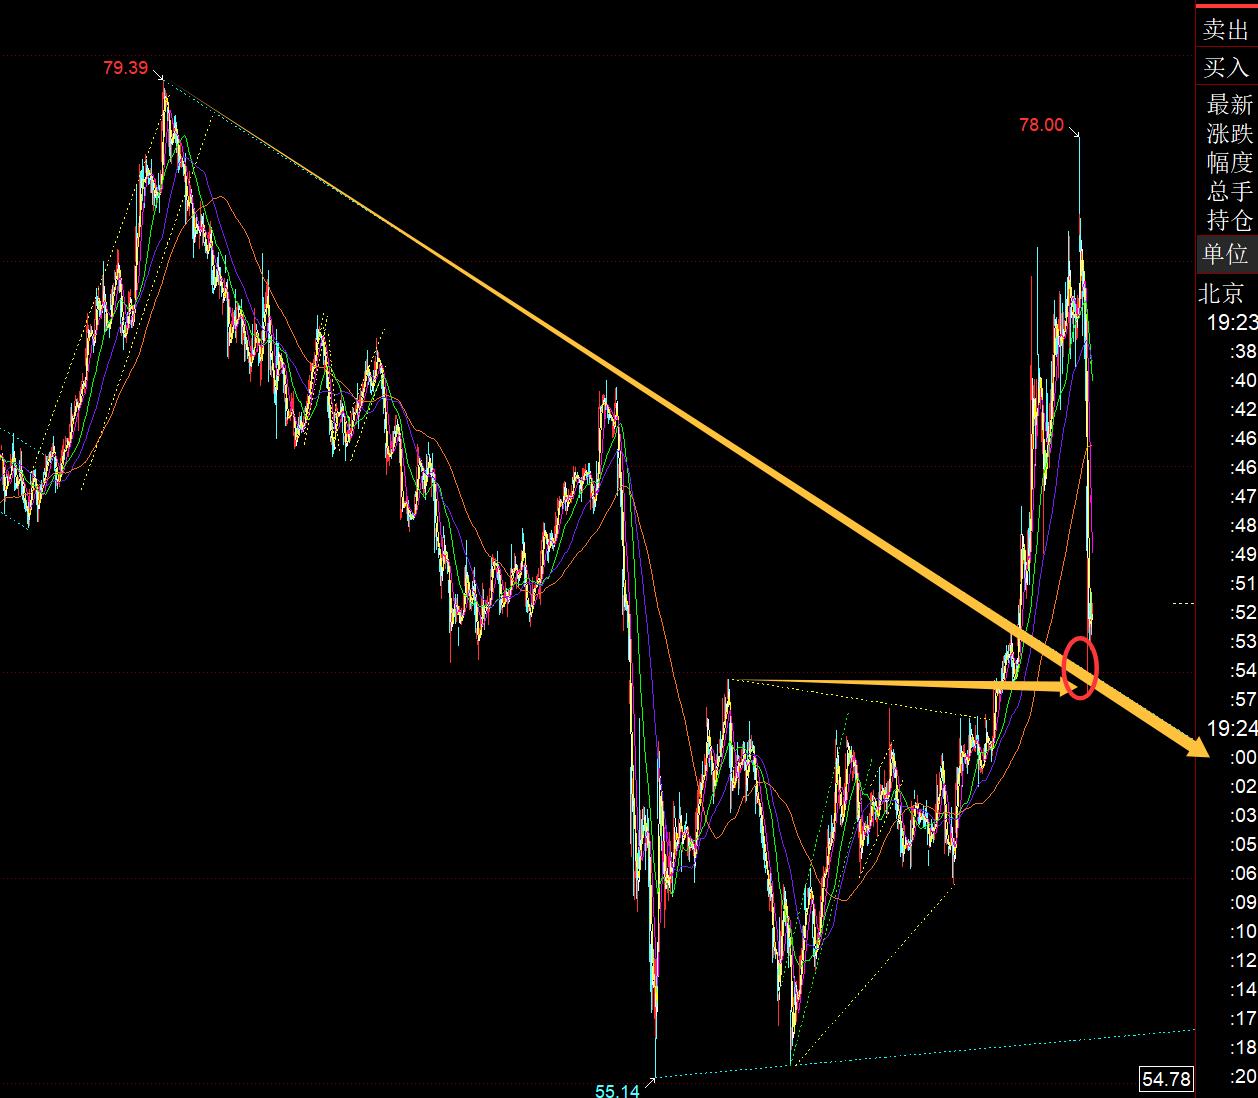
In terms of crude oil: It directly dives to the upper track position of the early convergence triangle, which also corresponds to the top and bottom position in the early stage. Therefore, the 65 line is the key tonight. If you can hold it, you will launch a rebound repairThe above are several points of the author's technical analysis, which are also the technical experience accumulated by the market and reviewing the market for more than 12 hours a day, and the technical points will be disclosed every day, and they will be interpreted in writing and video. If you want to learn, you can xmmarkets.cnpare and refer to the actual trend. If you recognize ideas, you can refer to the operation. Lead defense well, risk control first; if you don’t agree, just drift by; thank everyone for your support and attention;
[The article views are for reference only. Investment is risky. You need to be cautious when entering the market, rationally operate, strictly set losses, control positions, risk control first, and bear the profit and loss at your own risk]
Contributor: Zheng’s Dianyin
A study on the market for more than 12 hours a day, persist for ten years, and detailed technical interpretations are made public on the entire network, serving the whole network with sincerity, sincerity, perseverance and wholeheartedness! xmmarkets.cnments written on major financial websites! Proficient in the K-line rules, channel rules, time rules, moving average rules, segmentation rules, and top and bottom rules; student cooperation registration hotline - WeChat: zdf289984986
The above content is about "[XM Foreign Exchange Platform]: The war between Iran and Iran, gold prices fell sharply, "If you don't break, you won't establish, you won't break and then establish"" is carefully xmmarkets.cnpiled and edited by the editor of XM Foreign Exchange. I hope it will be helpful to your trading! Thanks for the support!
Life in the present, don’t waste your current life in missing the past or looking forward to the future.
Disclaimers: XM Group only provides execution services and access permissions for online trading platforms, and allows individuals to view and/or use the website or the content provided on the website, but has no intention of making any changes or extensions, nor will it change or extend its services and access permissions. All access and usage permissions will be subject to the following terms and conditions: (i) Terms and conditions; (ii) Risk warning; And (iii) a complete disclaimer. Please note that all information provided on the website is for general informational purposes only. In addition, the content of all XM online trading platforms does not constitute, and cannot be used for any unauthorized financial market trading invitations and/or invitations. Financial market transactions pose significant risks to your investment capital.
All materials published on online trading platforms are only intended for educational/informational purposes and do not include or should be considered for financial, investment tax, or trading related consulting and advice, or transaction price records, or any financial product or non invitation related trading offers or invitations.
All content provided by XM and third-party suppliers on this website, including opinions, news, research, analysis, prices, other information, and third-party website links, remains unchanged and is provided as general market commentary rather than investment advice. All materials published on online trading platforms are only for educational/informational purposes and do not include or should be considered as applicable to financial, investment tax, or trading related advice and recommendations, or transaction price records, or any financial product or non invitation related financial offers or invitations. Please ensure that you have read and fully understood the information on XM's non independent investment research tips and risk warnings. For more details, please click here