


Trusted by over 15 Million Traders
The Most Awarded Broker
for a Reason
Easy Access to 1,400+ Global Assets
EURUSD
Euro vs U.S. Dollar
US500
S&P 500 (US500)
GOLD
Gold
COFFEE
US Coffee
Apple
Apple (AAPL.OQ)
-

Finance Magnates 颁发
-

Finance Magnates 颁发
-

Capital Finance International Magazine (CFI.co) 2024年颁赠
-

COLWMA 2024年颁赠
-

荣获World Finance Forex Awards 2023最佳外汇客户服务奖
-

荣获World Finance Forex Awards 2023欧洲最佳外汇经纪商奖
-

荣获World Finance Forex Awards 2023澳大拉西亚最佳外汇经纪商奖
-

荣获World Finance Forex Awards 2023拉丁美洲最佳外汇经纪商奖
-

荣获World Finance Forex Awards 2023中东最佳外汇经纪商奖
-

CFI.co于2023年颁赠
-

荣获2023年City of London Wealth Management Awards
-

荣获2022年埃及金融博览会颁赠
-

荣获2022年City of London Wealth Management Awards
-

CFI.co于2022年颁赠
-

荣获Global Forex Awards 2022 — 零售外汇 颁赠
-
2021年迪拜外汇博览会获颁赠
-

Ultimate Fintech 2021年颁赠
-

荣获2021年City of London Wealth Management Awards
-

FX168于2020年12月颁赠
-

荣获Global Business Awards 2020
-

荣获2020年City of London Wealth Management Awards
-

Capital Finance International Magazine (CFI.co)颁赠
-

Capital Finance International Magazine (CFI.co)颁赠
-

荣获2019年City of London Wealth Management Awards
-

Shares Magazine 授予 UK Forex Awards 2018
-

Capital Finance International Magazine (CFI.co)颁赠
-

Capital Finance International Magazine (CFI.co)颁赠
-

2017年伦敦财富管理奖
-

2016最佳本土 客户服务
-

中东和北非地区(MENA)增长最快的经纪商
-
2015年最佳外汇科技提供商
-
2014年最佳外汇科技提供商
-

2014年最佳外汇科技提供商
-

荣获 The Trading Show 2024年非洲 Africa Fintech 峰会颁赠
-

荣获2024年中东地区 Brokersview 颁赠
-
荣获2024年中东地区 Brokersview 颁赠
-

荣获2024年阿曼 Smart Vision 峰会颁赠
-

荣获2024年迪拜外汇博览会颁赠
-

荣获2024年迪拜 Forex Traders Summit 颁赠
-

2024年埃及 Smart Vision 峰会颁赠
-

投查查于2024年颁赠
-

Capital Finance International Magazine (CFI.co) 2024年颁赠
-

CFI.co于2023年颁赠
-

CFI.co于2023年颁赠
-

交易社区平台FOLLOWME于2022年颁赠
-
2022年迪拜Forex Expo获颁赠
-
2022年迪拜Forex Expo获颁赠
-

荣获Global Forex Awards 2022 — 零售外汇 颁赠
-

CFI.co于2022年颁赠
-

CFI.co于2022年颁赠
-

World Finance Forex Awards 2022 颁发
-

World Finance Forex Awards 2022 颁发
-

World Finance Forex Awards 2022 颁发
-

World Finance Forex Awards 2022 颁发
-
交易社区平台FOLLOWME于2021年颁赠
-

2021年埃及Smart Vision Investment Expo博览会获颁赠
-

CFI.co于2021年颁赠
-

CFI.co于2021年颁赠
-

荣获Global Forex Awards 2021 — 零售外汇 颁赠
-

荣获Global Forex Awards 2021 — 零售外汇 颁赠
-

World Finance 2021颁发
-

World Finance 2021颁发
-
FOLLOWME于2021年颁赠
-

Global Forex Awards 2021 — B2B 颁赠
-

Global Forex Awards颁赠
-

Global Forex Awards颁赠
-

CFI.co于2020年颁赠
-

CFI.co于2020年颁赠
-

荣获Global Business Awards 2020
-

World Finance Magazine 颁赠
World Finance Forex Awards 2020 -

World Finance Magazine 颁赠
World Finance Forex Awards 2020 -
FOLLOWME交易社区授予
-

Global Forex Awards颁赠
-

Global Forex Awards颁赠
-

FinTech Age Awards颁发
-

World Finance Magazine 颁赠
World Finance Forex Awards 2019 -

World Finance Magazine 颁赠
World Finance Forex Awards 2019 -

荣获 World Finance Forex Awards 2018 颁赠
-

荣获2018年埃及金融博览会颁赠
-

荣获 Shares Magazine 的 UK Forex Awards 2017 颁赠
-

荣获 World Finance Forex Awards 2017
-

2016年最佳黄金经纪商
-

2016年最佳外汇经纪商
-

2015年最佳本地客户服务
-

Global Brands Magazine 颁赠
-

Online Money Awards 2022 颁发
-

荣获2022年埃及金融博览会颁赠
-

2015最佳外汇交易平台
-

2015最佳金融交易平台
-

2013最佳创新外汇平台奖
-

2020年 Cyprus HR Awards 颁赠
-

金融行业的佼佼者
-

认证最优金牌级别
-

2014年首届亚军
-
Finance Magnates 颁发
-
Finance Magnates 颁发
-
Capital Finance International Magazine (CFI.co) 2024年颁赠
-
COLWMA 2024年颁赠
-
荣获World Finance Forex Awards 2023最佳外汇客户服务奖
-
荣获World Finance Forex Awards 2023欧洲最佳外汇经纪商奖
-
荣获World Finance Forex Awards 2023澳大拉西亚最佳外汇经纪商奖
-
荣获World Finance Forex Awards 2023拉丁美洲最佳外汇经纪商奖
-
荣获World Finance Forex Awards 2023中东最佳外汇经纪商奖
-
CFI.co于2023年颁赠
-
荣获2023年City of London Wealth Management Awards
-
荣获2022年埃及金融博览会颁赠
-
荣获2022年City of London Wealth Management Awards
-
CFI.co于2022年颁赠
-
荣获Global Forex Awards 2022 — 零售外汇 颁赠
-
2021年迪拜外汇博览会获颁赠
-
Ultimate Fintech 2021年颁赠
-
荣获2021年City of London Wealth Management Awards
-
FX168于2020年12月颁赠
-
荣获Global Business Awards 2020
-
荣获2020年City of London Wealth Management Awards
-
Capital Finance International Magazine (CFI.co)颁赠
-
Capital Finance International Magazine (CFI.co)颁赠
-
荣获2019年City of London Wealth Management Awards
-
Shares Magazine 授予 UK Forex Awards 2018
-
Capital Finance International Magazine (CFI.co)颁赠
-
Capital Finance International Magazine (CFI.co)颁赠
-
2017年伦敦财富管理奖
-
2016最佳本土 客户服务
-
中东和北非地区(MENA)增长最快的经纪商
-
2015年最佳外汇科技提供商
-
2014年最佳外汇科技提供商
-
2014年最佳外汇科技提供商
-
荣获 The Trading Show 2024年非洲 Africa Fintech 峰会颁赠
-
荣获2024年中东地区 Brokersview 颁赠
-
荣获2024年中东地区 Brokersview 颁赠
-
荣获2024年阿曼 Smart Vision 峰会颁赠
-
荣获2024年迪拜外汇博览会颁赠
-
荣获2024年迪拜 Forex Traders Summit 颁赠
-
2024年埃及 Smart Vision 峰会颁赠
-
投查查于2024年颁赠
-
Capital Finance International Magazine (CFI.co) 2024年颁赠
-
CFI.co于2023年颁赠
-
CFI.co于2023年颁赠
-
交易社区平台FOLLOWME于2022年颁赠
-
2022年迪拜Forex Expo获颁赠
-
2022年迪拜Forex Expo获颁赠
-
荣获Global Forex Awards 2022 — 零售外汇 颁赠
-
CFI.co于2022年颁赠
-
CFI.co于2022年颁赠
-
World Finance Forex Awards 2022 颁发
-
World Finance Forex Awards 2022 颁发
-
World Finance Forex Awards 2022 颁发
-
World Finance Forex Awards 2022 颁发
-
交易社区平台FOLLOWME于2021年颁赠
-
2021年埃及Smart Vision Investment Expo博览会获颁赠
-
CFI.co于2021年颁赠
-
CFI.co于2021年颁赠
-
荣获Global Forex Awards 2021 — 零售外汇 颁赠
-
荣获Global Forex Awards 2021 — 零售外汇 颁赠
-
World Finance 2021颁发
-
World Finance 2021颁发
-
FOLLOWME于2021年颁赠
-
Global Forex Awards 2021 — B2B 颁赠
-
Global Forex Awards颁赠
-
Global Forex Awards颁赠
-
CFI.co于2020年颁赠
-
CFI.co于2020年颁赠
-
荣获Global Business Awards 2020
-
World Finance Magazine 颁赠
World Finance Forex Awards 2020 -
World Finance Magazine 颁赠
World Finance Forex Awards 2020 -
FOLLOWME交易社区授予
-
Global Forex Awards颁赠
-
Global Forex Awards颁赠
-
FinTech Age Awards颁发
-
World Finance Magazine 颁赠
World Finance Forex Awards 2019 -
World Finance Magazine 颁赠
World Finance Forex Awards 2019 -
荣获 World Finance Forex Awards 2018 颁赠
-
荣获2018年埃及金融博览会颁赠
-
荣获 Shares Magazine 的 UK Forex Awards 2017 颁赠
-
荣获 World Finance Forex Awards 2017
-
2016年最佳黄金经纪商
-
2016年最佳外汇经纪商
-
2015年最佳本地客户服务
-
Global Brands Magazine 颁赠
-
Online Money Awards 2022 颁发
-
荣获2022年埃及金融博览会颁赠
-
2015最佳外汇交易平台
-
2015最佳金融交易平台
-
2013最佳创新外汇平台奖
-
2020年 Cyprus HR Awards 颁赠
-
金融行业的佼佼者
-
认证最优金牌级别
-
2014年首届亚军

Awarded BestBrokerYear After Year
CATEGORIES
News
- 【XM Group】--BTC/USD Forex Signal: Bullish Breakout to New Record High
- 【XM Group】--USD/MYR: Selling Develops Near-Term as Choppiness Escalates
- 【XM Decision Analysis】--USD/MXN Forecast :US Dollar Continues to Consolidate Aga
- 【XM Market Analysis】--USD/SGD Analysis: Lower Price Values as Agitation Remains
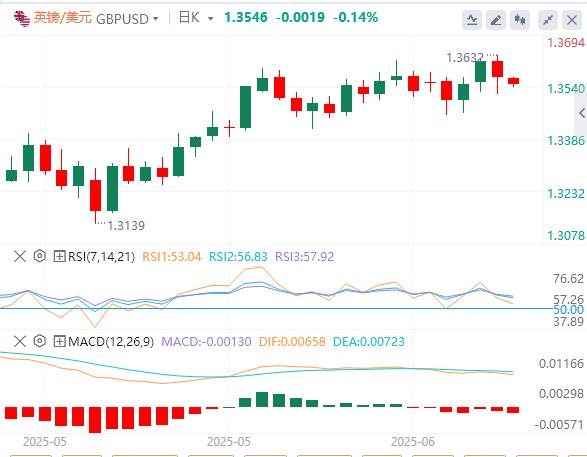
- 【XM Forex】--GBP/USD Forecast: Looking for Higher Levels
market news
The United States may intervene in the Iraq-Israel conflict! Netanyahu reveals conspiracy to "assassinate Trump" and the Bank of Japan is about to turn
Wonderful Introduction:
Life is full of dangers and traps, but I will never be afraid anymore. I will always remember. Be a strong person. Let "strong" set sail for me and always accompany me to the other side of life.
Hello everyone, today XM Forex will bring you "[XM Group]: The United States may intervene in the Iraq-Israel conflict! Netanyahu revealed a conspiracy to "assassinate Trump", and the Bank of Japan is about to turn." Hope it will be helpful to you! The original content is as follows:
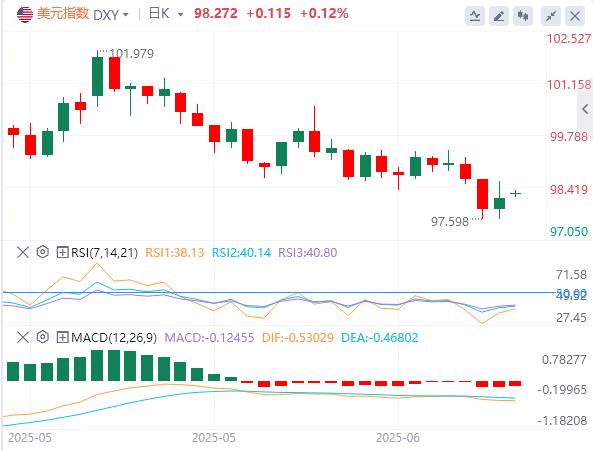
On June 16, early trading in the Asian market on Monday, Beijing time, the US dollar index hovered around 98.27. Last Friday, markets bought safe-haven assets as Israeli attacks on Iran led to a heightened geopolitical tension in the Middle East. The US dollar index rose, regaining the 98 mark and finally closed up 0.31% to 98.14. The benchmark 10-year U.S. Treasury yield closed at 4.4046%, while the 2-year U.S. Treasury yield closed at 3.9580%. Spot gold once stood above the $3440 mark in the early trading, and then maintained a wide fluctuation, finally closing up 1.41%, closing at $3433.35/ounce; spot silver hit the intraday high of 36.62 and then fell back, finally closing down 0.12%, at $36.29/ounce. International oil prices rose sharply due to the tension in Israel and Iran, which has caused investors to worry about the hindrance of oil exports in the Middle East. WTI crude oil once rose more than 13%, the largest intraday increase since 2022, and finally closed up 5.94% to $72.91 per barrel; Brent crude oil once exceeded $76 per barrel, the first time since February 21, and finally closed up 5.85% to $74.38 per barrel.
Analysis of major currencies
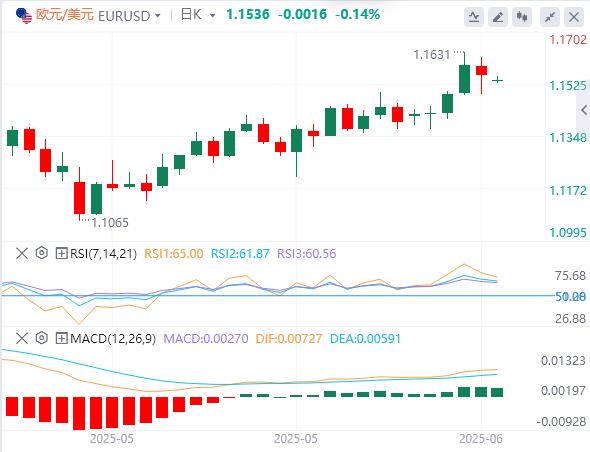
Dollar Index: As of press time, the US dollar index hovers around 98.27. The dollar rose against major currencies such as the euro and the yen last Friday, and Israeli attacks on Iran led to intensifying geopolitical tensions in the Middle East, and markets bought safe-haven assets. Markets will focus on Fed's resolution this week, with markets generally expecting the Fed to keep interest rates unchanged, and investors will focus on the latest forecasts of the Fed that will reveal how much policymakers value recent weak data and what they think is pendingTrade and budgetary issues and the extent to which the intensified conflict in the Middle East poses risks. Technically, if the US dollar index returns below the support level of 99.00–99.20, it will move towards the next support level in the range of 96.70–96.90.
Analysis of gold and crude oil market trends
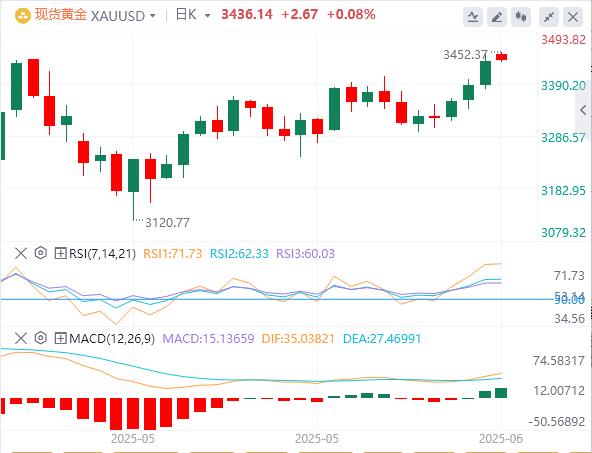
1) Analysis of gold market trends
On the Asian session on Monday, gold trading around 3436.14. The escalating conflict between Israel and Iran has prompted investors to turn to safe-haven assets. In early Asian trading on Monday, gold prices rose 0.6% to above $3,450 per ounce, about $50 away from the all-time high in April. The sudden rise in geopolitical risks has added more momentum to the rise in gold prices, which is driven mainly by the threat of Trump's radical tariff agenda to global economic growth. Gold rose more than 30% in 2025, and central banks seeking to diversify from the dollar is anotherAn important driving force.
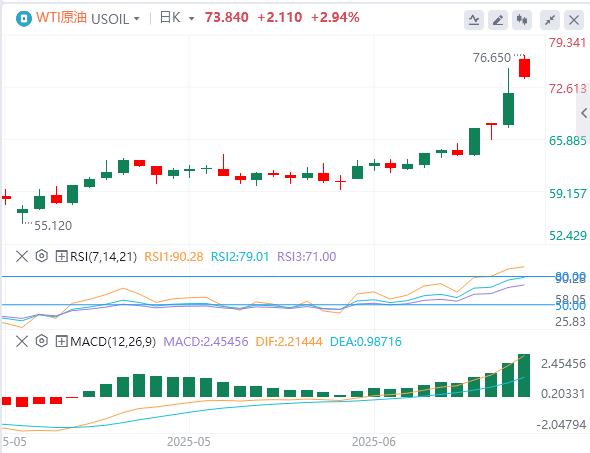
2) Analysis of crude oil market trends
On the Asian session on Monday, crude oil trading around 73.84. As tensions in the Middle East continue over the weekend, oil prices may benefit from geopolitical tensions, with the focus on Iran's retaliation measures, whether they involve the Strait of Hormuz. If relevant aspects are touched, the increase in oil prices may expand sharply, and the US oil price threshold at the beginning of the year may break through rapidly; in addition, the oil market will also usher in the OPEC monthly report next week, and the IEA monthly report is worth paying attention to.
Technical surface: Technical daily chart, last Friday's bullish momentum pushed prices to decisively break through the 100-day and 200-day SMA, enhancing the possibility of further rises. The overlap with the long-term Fibonacci level adds credibility to the breakthrough. The Relative Strength Index (RSI) on the daily time frame is currently at 76, showing an overbought status. However, as the geopolitical background intensifies, fundamental support may eventually overcome short-term weakness. On the weekly chart, WTI broke through $63.29 12-week SMA after Iran’s upgrade with Israel, marking a key shift in sentiment. The surge pushed the price to the 78.6% Fibonacci retracement level of $74.11. The 12-week SMA continues to provide support around $63.31, highlighting the strong foundation for the bulls.
① To be determined OPEC released its monthly crude oil market report
②09:30 Monthly report on residential price prices in 70 large and medium-sized cities in China
③10:00 China's total retail sales of consumer goods in May year-on-year
④10:00 China's industrial added value above scale in May year-on-year
⑤20:30 United States New York Fed Manufacturing Index in June
The above content is about "【XM Group]: The United States may intervene in the conflict between Iran and Israel! Netanyahu revealed that the plot of "assassination of Trump" and the Bank of Japan is about to turn around" was carefully xmmarkets.cnpiled and edited by the editor of XM Forex. I hope it will be helpful to your transaction! Thanks for the support!
In fact, responsibility is not helpless, it is not boring, it is as gorgeous as a rainbow. It is this colorful responsibility that has created a better life for us today. I will try my best to organize the article.
Disclaimers: XM Group only provides execution services and access permissions for online trading platforms, and allows individuals to view and/or use the website or the content provided on the website, but has no intention of making any changes or extensions, nor will it change or extend its services and access permissions. All access and usage permissions will be subject to the following terms and conditions: (i) Terms and conditions; (ii) Risk warning; And (iii) a complete disclaimer. Please note that all information provided on the website is for general informational purposes only. In addition, the content of all XM online trading platforms does not constitute, and cannot be used for any unauthorized financial market trading invitations and/or invitations. Financial market transactions pose significant risks to your investment capital.
All materials published on online trading platforms are only intended for educational/informational purposes and do not include or should be considered for financial, investment tax, or trading related consulting and advice, or transaction price records, or any financial product or non invitation related trading offers or invitations.
All content provided by XM and third-party suppliers on this website, including opinions, news, research, analysis, prices, other information, and third-party website links, remains unchanged and is provided as general market commentary rather than investment advice. All materials published on online trading platforms are only for educational/informational purposes and do not include or should be considered as applicable to financial, investment tax, or trading related advice and recommendations, or transaction price records, or any financial product or non invitation related financial offers or invitations. Please ensure that you have read and fully understood the information on XM's non independent investment research tips and risk warnings. For more details, please click here