


Trusted by over 15 Million Traders
The Most Awarded Broker
for a Reason
Easy Access to 1,400+ Global Assets
EURUSD
Euro vs U.S. Dollar
US500
S&P 500 (US500)
GOLD
Gold
COFFEE
US Coffee
Apple
Apple (AAPL.OQ)
-

Finance Magnates 颁发
-

Finance Magnates 颁发
-

Capital Finance International Magazine (CFI.co) 2024年颁赠
-

COLWMA 2024年颁赠
-

荣获World Finance Forex Awards 2023最佳外汇客户服务奖
-

荣获World Finance Forex Awards 2023欧洲最佳外汇经纪商奖
-

荣获World Finance Forex Awards 2023澳大拉西亚最佳外汇经纪商奖
-

荣获World Finance Forex Awards 2023拉丁美洲最佳外汇经纪商奖
-

荣获World Finance Forex Awards 2023中东最佳外汇经纪商奖
-

CFI.co于2023年颁赠
-

荣获2023年City of London Wealth Management Awards
-

荣获2022年埃及金融博览会颁赠
-

荣获2022年City of London Wealth Management Awards
-

CFI.co于2022年颁赠
-

荣获Global Forex Awards 2022 — 零售外汇 颁赠
-
2021年迪拜外汇博览会获颁赠
-

Ultimate Fintech 2021年颁赠
-

荣获2021年City of London Wealth Management Awards
-

FX168于2020年12月颁赠
-

荣获Global Business Awards 2020
-

荣获2020年City of London Wealth Management Awards
-

Capital Finance International Magazine (CFI.co)颁赠
-

Capital Finance International Magazine (CFI.co)颁赠
-

荣获2019年City of London Wealth Management Awards
-

Shares Magazine 授予 UK Forex Awards 2018
-

Capital Finance International Magazine (CFI.co)颁赠
-

Capital Finance International Magazine (CFI.co)颁赠
-

2017年伦敦财富管理奖
-

2016最佳本土 客户服务
-

中东和北非地区(MENA)增长最快的经纪商
-
2015年最佳外汇科技提供商
-
2014年最佳外汇科技提供商
-

2014年最佳外汇科技提供商
-

荣获 The Trading Show 2024年非洲 Africa Fintech 峰会颁赠
-

荣获2024年中东地区 Brokersview 颁赠
-
荣获2024年中东地区 Brokersview 颁赠
-

荣获2024年阿曼 Smart Vision 峰会颁赠
-

荣获2024年迪拜外汇博览会颁赠
-

荣获2024年迪拜 Forex Traders Summit 颁赠
-

2024年埃及 Smart Vision 峰会颁赠
-

投查查于2024年颁赠
-

Capital Finance International Magazine (CFI.co) 2024年颁赠
-

CFI.co于2023年颁赠
-

CFI.co于2023年颁赠
-

交易社区平台FOLLOWME于2022年颁赠
-
2022年迪拜Forex Expo获颁赠
-
2022年迪拜Forex Expo获颁赠
-

荣获Global Forex Awards 2022 — 零售外汇 颁赠
-

CFI.co于2022年颁赠
-

CFI.co于2022年颁赠
-

World Finance Forex Awards 2022 颁发
-

World Finance Forex Awards 2022 颁发
-

World Finance Forex Awards 2022 颁发
-

World Finance Forex Awards 2022 颁发
-
交易社区平台FOLLOWME于2021年颁赠
-

2021年埃及Smart Vision Investment Expo博览会获颁赠
-

CFI.co于2021年颁赠
-

CFI.co于2021年颁赠
-

荣获Global Forex Awards 2021 — 零售外汇 颁赠
-

荣获Global Forex Awards 2021 — 零售外汇 颁赠
-

World Finance 2021颁发
-

World Finance 2021颁发
-
FOLLOWME于2021年颁赠
-

Global Forex Awards 2021 — B2B 颁赠
-

Global Forex Awards颁赠
-

Global Forex Awards颁赠
-

CFI.co于2020年颁赠
-

CFI.co于2020年颁赠
-

荣获Global Business Awards 2020
-

World Finance Magazine 颁赠
World Finance Forex Awards 2020 -

World Finance Magazine 颁赠
World Finance Forex Awards 2020 -
FOLLOWME交易社区授予
-

Global Forex Awards颁赠
-

Global Forex Awards颁赠
-

FinTech Age Awards颁发
-

World Finance Magazine 颁赠
World Finance Forex Awards 2019 -

World Finance Magazine 颁赠
World Finance Forex Awards 2019 -

荣获 World Finance Forex Awards 2018 颁赠
-

荣获2018年埃及金融博览会颁赠
-

荣获 Shares Magazine 的 UK Forex Awards 2017 颁赠
-

荣获 World Finance Forex Awards 2017
-

2016年最佳黄金经纪商
-

2016年最佳外汇经纪商
-

2015年最佳本地客户服务
-

Global Brands Magazine 颁赠
-

Online Money Awards 2022 颁发
-

荣获2022年埃及金融博览会颁赠
-

2015最佳外汇交易平台
-

2015最佳金融交易平台
-

2013最佳创新外汇平台奖
-

2020年 Cyprus HR Awards 颁赠
-

金融行业的佼佼者
-

认证最优金牌级别
-

2014年首届亚军
-
Finance Magnates 颁发
-
Finance Magnates 颁发
-
Capital Finance International Magazine (CFI.co) 2024年颁赠
-
COLWMA 2024年颁赠
-
荣获World Finance Forex Awards 2023最佳外汇客户服务奖
-
荣获World Finance Forex Awards 2023欧洲最佳外汇经纪商奖
-
荣获World Finance Forex Awards 2023澳大拉西亚最佳外汇经纪商奖
-
荣获World Finance Forex Awards 2023拉丁美洲最佳外汇经纪商奖
-
荣获World Finance Forex Awards 2023中东最佳外汇经纪商奖
-
CFI.co于2023年颁赠
-
荣获2023年City of London Wealth Management Awards
-
荣获2022年埃及金融博览会颁赠
-
荣获2022年City of London Wealth Management Awards
-
CFI.co于2022年颁赠
-
荣获Global Forex Awards 2022 — 零售外汇 颁赠
-
2021年迪拜外汇博览会获颁赠
-
Ultimate Fintech 2021年颁赠
-
荣获2021年City of London Wealth Management Awards
-
FX168于2020年12月颁赠
-
荣获Global Business Awards 2020
-
荣获2020年City of London Wealth Management Awards
-
Capital Finance International Magazine (CFI.co)颁赠
-
Capital Finance International Magazine (CFI.co)颁赠
-
荣获2019年City of London Wealth Management Awards
-
Shares Magazine 授予 UK Forex Awards 2018
-
Capital Finance International Magazine (CFI.co)颁赠
-
Capital Finance International Magazine (CFI.co)颁赠
-
2017年伦敦财富管理奖
-
2016最佳本土 客户服务
-
中东和北非地区(MENA)增长最快的经纪商
-
2015年最佳外汇科技提供商
-
2014年最佳外汇科技提供商
-
2014年最佳外汇科技提供商
-
荣获 The Trading Show 2024年非洲 Africa Fintech 峰会颁赠
-
荣获2024年中东地区 Brokersview 颁赠
-
荣获2024年中东地区 Brokersview 颁赠
-
荣获2024年阿曼 Smart Vision 峰会颁赠
-
荣获2024年迪拜外汇博览会颁赠
-
荣获2024年迪拜 Forex Traders Summit 颁赠
-
2024年埃及 Smart Vision 峰会颁赠
-
投查查于2024年颁赠
-
Capital Finance International Magazine (CFI.co) 2024年颁赠
-
CFI.co于2023年颁赠
-
CFI.co于2023年颁赠
-
交易社区平台FOLLOWME于2022年颁赠
-
2022年迪拜Forex Expo获颁赠
-
2022年迪拜Forex Expo获颁赠
-
荣获Global Forex Awards 2022 — 零售外汇 颁赠
-
CFI.co于2022年颁赠
-
CFI.co于2022年颁赠
-
World Finance Forex Awards 2022 颁发
-
World Finance Forex Awards 2022 颁发
-
World Finance Forex Awards 2022 颁发
-
World Finance Forex Awards 2022 颁发
-
交易社区平台FOLLOWME于2021年颁赠
-
2021年埃及Smart Vision Investment Expo博览会获颁赠
-
CFI.co于2021年颁赠
-
CFI.co于2021年颁赠
-
荣获Global Forex Awards 2021 — 零售外汇 颁赠
-
荣获Global Forex Awards 2021 — 零售外汇 颁赠
-
World Finance 2021颁发
-
World Finance 2021颁发
-
FOLLOWME于2021年颁赠
-
Global Forex Awards 2021 — B2B 颁赠
-
Global Forex Awards颁赠
-
Global Forex Awards颁赠
-
CFI.co于2020年颁赠
-
CFI.co于2020年颁赠
-
荣获Global Business Awards 2020
-
World Finance Magazine 颁赠
World Finance Forex Awards 2020 -
World Finance Magazine 颁赠
World Finance Forex Awards 2020 -
FOLLOWME交易社区授予
-
Global Forex Awards颁赠
-
Global Forex Awards颁赠
-
FinTech Age Awards颁发
-
World Finance Magazine 颁赠
World Finance Forex Awards 2019 -
World Finance Magazine 颁赠
World Finance Forex Awards 2019 -
荣获 World Finance Forex Awards 2018 颁赠
-
荣获2018年埃及金融博览会颁赠
-
荣获 Shares Magazine 的 UK Forex Awards 2017 颁赠
-
荣获 World Finance Forex Awards 2017
-
2016年最佳黄金经纪商
-
2016年最佳外汇经纪商
-
2015年最佳本地客户服务
-
Global Brands Magazine 颁赠
-
Online Money Awards 2022 颁发
-
荣获2022年埃及金融博览会颁赠
-
2015最佳外汇交易平台
-
2015最佳金融交易平台
-
2013最佳创新外汇平台奖
-
2020年 Cyprus HR Awards 颁赠
-
金融行业的佼佼者
-
认证最优金牌级别
-
2014年首届亚军

Awarded BestBrokerYear After Year
CATEGORIES
News
- 【XM Forex】--BTC/USD Forecast: Sees a Small Pullback on Wednesday
- 【XM Market Analysis】--BTC/USD Forecast: Continues to Look Positive but Contained
- 【XM Decision Analysis】--GBP/USD Forex Signal: Bearish Flag Pattern Forms
- 【XM Decision Analysis】--GBP/USD Weekly Forecast: Interest Rate Cut and More Weak
- 【XM Market Analysis】--USD/CHF Forecast: US Dollar Continues to Climb Against the
market analysis
Gold, 3200 Life and Death Line, Europe and the United States follow the weekly support
Wonderful introduction:
Let your sorrows be full of worries, and you can't sleep, and you can't sleep. The full moon hangs high, scattered all over the ground. I think that the bright moon will be ruthless, and the wind and frost will fade away for thousands of years, and the passion will fade away easily. If there is love, it should have grown old with the wind. Knowing that the moon is ruthless, why do you repeatedly express your love to the bright moon?
Hello everyone, today XM Foreign Exchange will bring you "[XM Foreign Exchange Market Review]: Gold, 3200 Life and Death Line, Europe and the United States will follow weekly support in the future." Hope it will be helpful to you! The original content is as follows:
Macro
On May 12, the global financial market fluctuated violently, and the gold market ushered in a "Black Monday". Spot gold fell to $3,207.63 per ounce intraday low, and the main xmmarkets.cnEX gold futures contract plummeted 3.5%, setting the worst single-day performance in 2025. The sell-off stems from the 90-day "truce agreement" reached by China and the United States. The two sides significantly lowered tariffs, market demand for hedging plummeted, gold hedging attributes weakened, funds turned into risky assets, and the three major U.S. stock indexes closed sharply. However, there are still many uncertainties in the market. The Chicago Fed Chairman pointed out that the remaining tariffs have a stagflation effect, and the upcoming CPI data released this week will become the key. If it exceeds expectations, gold's anti-inflation attributes may be re-evaluated. At the same time, geopolitical risks such as India-Pakistan nuclear deterrence and Russia-Ukraine peace talks still exist, which may once again stimulate risk aversion. For investors, we need to be wary of the rebound in gold prices caused by CPI data being inferior to expectations, as well as the impact of policy adjustments in the Federal Reserve's interest rate agenda meeting in June, pay close attention to economic and geopolitical dynamics, and rationally allocate assets.
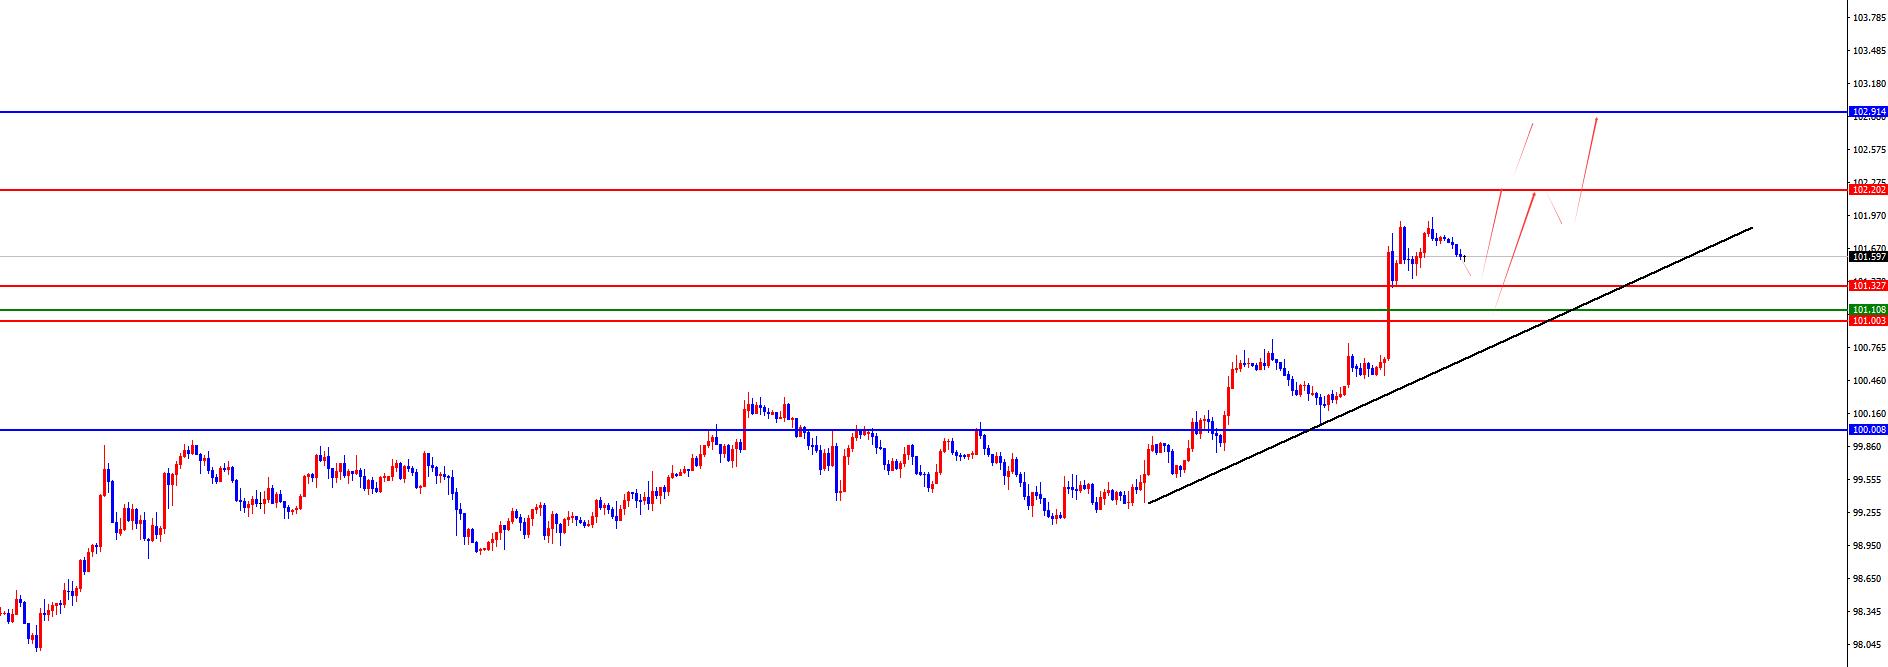
Dollar Index
In terms of the performance of the US dollar index, the US dollar index showed an upward trend on Monday. The price of the US dollar index rose to 101.955 on the day, and fell to 400.4 at the lowest, and finally closed at 101.777. Looking back at the market performance on Monday, the price opened directly in the short term during the early trading session, and then fluctuated again in the European session. The price closed strongly at a high level on the same day. Currently, the US dollar index is operating according to the path analyzed by the author, and the subsequent attention will be further continued.
From the multi-cycle analysis, the price is suppressed in the 102.90 area resistance, then from the medium-term perspectiveStarting from the corner, the trend of the US dollar index will be more bearish. At the daily level, the key price support position is in the 100 area over time, so the subsequent bands are bullish. At the same time, according to the four-hour level, the price further rose yesterday based on the four-hour support, and is currently supporting in the 100.00-10 area. At the same time, according to the short-term one hour, yesterday's price closed strongly at a high level. The low point of yesterday's retracement of 101.30 will become the key support. We will pay attention to this position and four-hour support in the future to further look upward. Conservatives are waiting for the trend line to support more, and radicals can look upward before the four-hour support, and the short-term focus on the 102.20-102.90 area above.
The US dollar index has a long range of 101.10-20, with a defense of 5 US dollars, and a target of 102.20-90
Gold
In terms of gold, the gold price overall showed a sharp decline on Monday. The price rose to the highest point of 3292.03 on the same day, and fell to the lowest point of 3207.63 on the spot, closing at 3234.64. In response to the fact that gold first opened low during the early trading session on Monday, the market price fluctuated and continued to maintain its weak performance. The price bottomed out in the short term after the US session, and finally closed the market with a big negative ending on the same day. However, before the price has fallen below the recent fluctuation low of 3200, you need to be cautious about shorting and beware of repeated performance in this area.
From a multi-cycle analysis, first observe the monthly rhythm. The price has risen in the early stage for three months and then a single-month correction. Recently, it has risen in the recent four-month period, so according to the rhythm, there have been four consecutive positives. For the current May, we must pay attention to market risks. From the weekly level, gold prices are supported by the support level in the 3100 area. So from a mid-term perspective, we can continue to maintain a bullish view, and the price decline is only a correction in the medium-term rise. From the daily level, after the opening of yesterday Monday, the price gap directly broke the daily support position, and the previous support changed resistance. Currently, the upper daily resistance is in the 3307 area, and the gap position is also the key resistance of the daily line. At the same time, from the four-hour level, as time goes by, the upper 3278 is currently the key resistance, so the daily line and four-hour shortage are currently on the spot. However, looking at the price in one hour, the price fell yesterday close to the recent fluctuation low of 3200. The price currently shows a rebound adjustment at this position, so be cautious for the time being. Beware of repeated tossing prices. So be cautious and blindly chase short before the price breaks.
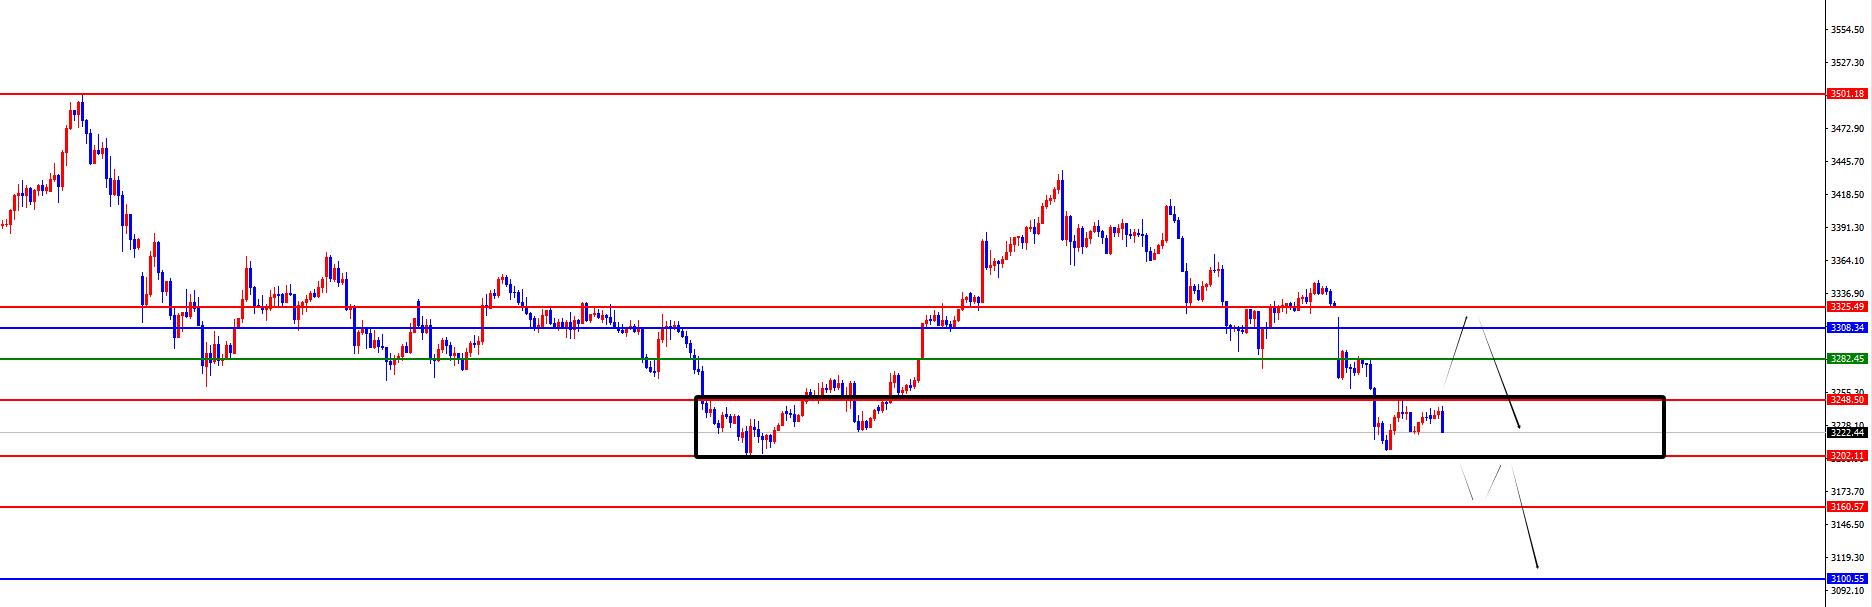
Gold is temporarily concerned about the gains and losses of 3200, be cautious before breaking down, and be careful to prevent the market from going back and forth
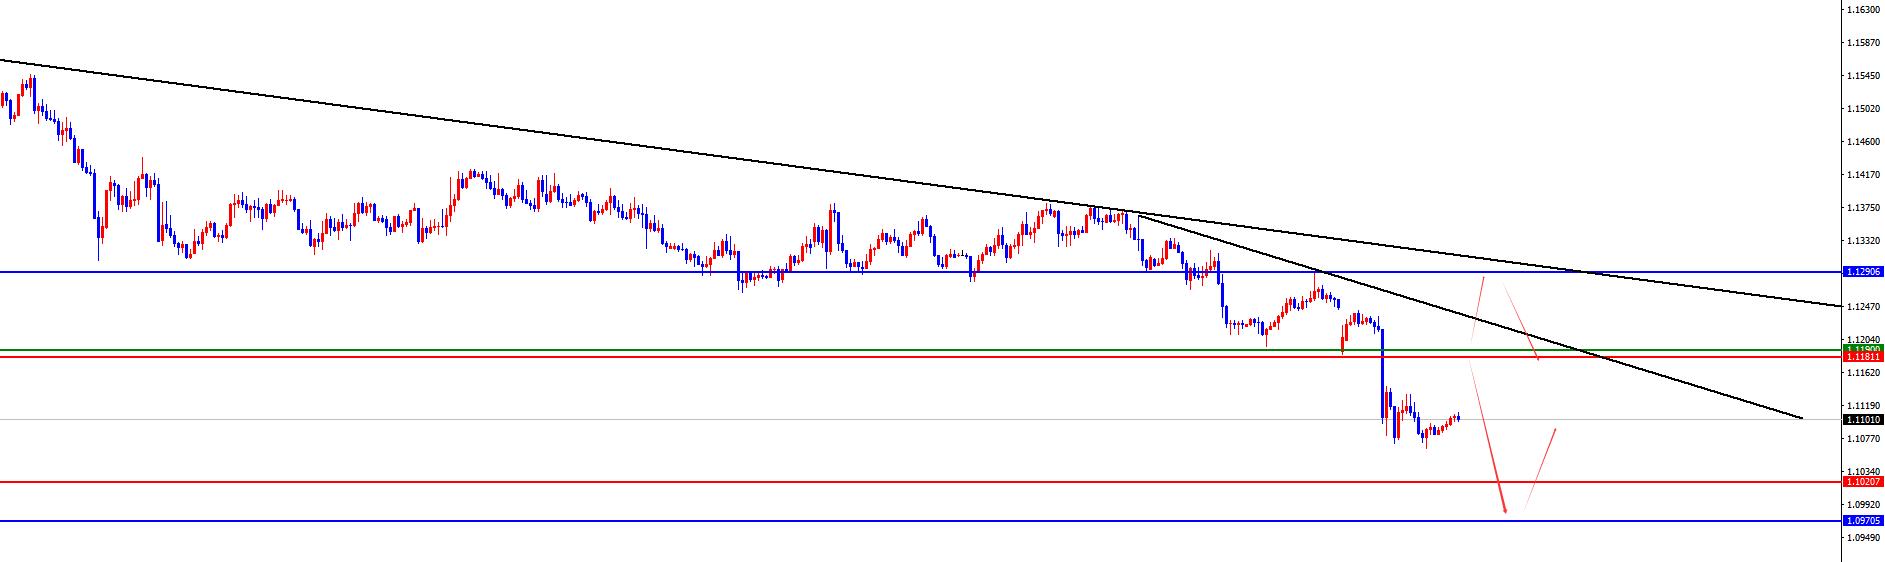
Europe and the United States
Europe and the United States
Europe and the United States, prices in Europe and the United States were generally down on Monday. Prices fell to 1 at the lowest price on the day.1242 position, the highest rise to 1.1064 position, closing at 1.1085 position. Looking back at the performance of European and American markets on Monday, the opening price in the morning first opened low in the short term, and then the market fluctuated and continued to fall. The US market also showed a volatile decline after the session, and the daily line ended in a big negative situation.
From a multi-cycle analysis, from the monthly level, Europe and the United States are supported by 1.0800, so long-term bulls are treated. From the weekly level, the price is supported by the 1.0960 area, and continues to be bullish from the perspective of the mid-line. The price decline is temporarily treated as a correction in the mid-line rise. From the daily level, the price breaks down the daily support after the recent high fluctuation, and at the same time, the price continues to suppress the daily resistance after the breakdown. For short-term short-term treatment at 1.1290 on the band, it will only turn upward after the subsequent breakdown, otherwise it will be short-term treatment on the right. From the short-term four-hour level, the current four-hour level resistance is at the 1.1180-90 area resistance. In the short term, we pay attention to this area to suppress European and American prices, and in the short term, we pay attention to the 1.1020-1.0970 area below.
Europe and the United States have a short range of 1.1180-90, defense is 50 points, target 1.1020-1.0970
[Finance data and events that are focused today] Tuesday, May 13, 2025
① To be determined. US President Trump visits Saudi Arabia, Qatar and the United Arab Emirates.
②07:50 Bank of Japan announces summary of opinions from members of the review of the April Monetary Policy Conference
③14:00 UK three-month ILO unemployment rate
④14:00 UK April unemployment rate
⑤14:00 UK April unemployment rate
⑤14:00 UK April unemployment claim applicants
⑥17:00 Germany May ZEW economic prosperity index
⑦17:00 Euro District May ZEW Economic Prosperity Index
⑧18:00 US April NFIB Small Business Confidence Index
⑨20:30 US April unseasonally adjusted CPI annual rate
⑩20:30 US April seasonally adjusted CPI monthly rate
20:30 US April seasonally adjusted core CPI monthly rate
20:30 US April seasonally adjusted core CPI annual rate
23:00 Bank of England Governor Bailey delivered a speech
04:30 US the next day to May 9 API crude oil inventories
Note: The above is only personal opinions and strategies, for reference and xmmarkets.cnmunication only, and does not give customers any investment advice. It has nothing to do with customers' investment, and is not used as a basis for placing an order.
The above content is all about "[XM Foreign Exchange Market Review]: Gold, 3200 Life and Death Line, Europe and the United States follow the weekly support". It is carefully xmmarkets.cnpiled and edited by the XM Foreign Exchange editor. I hope it will be helpful to your trading! Thanks for the support!
Only the strong know how to fight; the weak are not qualified to fail, but are born to be conquered. Step up to learn the next article!
Disclaimers: XM Group only provides execution services and access permissions for online trading platforms, and allows individuals to view and/or use the website or the content provided on the website, but has no intention of making any changes or extensions, nor will it change or extend its services and access permissions. All access and usage permissions will be subject to the following terms and conditions: (i) Terms and conditions; (ii) Risk warning; And (iii) a complete disclaimer. Please note that all information provided on the website is for general informational purposes only. In addition, the content of all XM online trading platforms does not constitute, and cannot be used for any unauthorized financial market trading invitations and/or invitations. Financial market transactions pose significant risks to your investment capital.
All materials published on online trading platforms are only intended for educational/informational purposes and do not include or should be considered for financial, investment tax, or trading related consulting and advice, or transaction price records, or any financial product or non invitation related trading offers or invitations.
All content provided by XM and third-party suppliers on this website, including opinions, news, research, analysis, prices, other information, and third-party website links, remains unchanged and is provided as general market commentary rather than investment advice. All materials published on online trading platforms are only for educational/informational purposes and do not include or should be considered as applicable to financial, investment tax, or trading related advice and recommendations, or transaction price records, or any financial product or non invitation related financial offers or invitations. Please ensure that you have read and fully understood the information on XM's non independent investment research tips and risk warnings. For more details, please click here